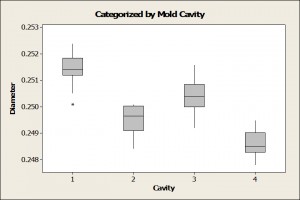
As we cover Six Sigma Statistics, I want to make sure that I go over the illustrative part of the statistics. We know Six Sigma is technical but the key to making it stick, is to make it simple and understood by the non-technical people using it. So let’s talk about the Box Plot or the Whisker Plot. A key thing to remember in Six Sigma is that everyone using different terminology, so ask questions and make sure you are speaking the same language.
What is a Box Plot?
Simply put a box plot helps to put a picture to the data showing you where most of the data falls, how the data is distributed and where the outliers are. So it basically shows you what you’ve got, how it looks and what is unusual about it.
What does it measure?
Say you have a process that has multiple variables affecting it and you want to know what is what. If you have a delivery truck with 4 alternative routes a box plot can show you which ones, according to the data, are the most problematic. Additionally a box plot will tell you how symmetrical your data is. Knowing if your data is skewed or not can affect how you interpret your data. In a box plot, if the data is mostly symmetrical the median will appear in the middle of the box and the whiskers will appear to be mostly the same length. IF the data is skewed to one direction, the median will not be in the middle and the whiskers will be different sizes.
How does it work?
Box plot measurements are based on quartiles and the distributions are shown within the graphic. Think back to your SAT’s or ACT’s. Remember how they told you that you scored in the 25th percentile? Well that’s a box plot. You will have an upper limit and a lower limit and those limits will be determined by your organization’s goals. The outliers will be the extreme values, values that are so far outside of the normal distribution that it is unlikely they will be reproduced.
Interpreting your data is just as important as gathering it, so choose carefully and with purpose. Talk to your belt and use that advice to help you find the best method for your organization.

