Around the world in dozens of offices, someone was trained and then given Six Sigma projects. Some were trained well and recognize that you won’t use every Six Sigma tool for every project. Some were trained by a self-important belt who taught them to use every single Six Sigma tool there is.
So what I want to talk to you about this week are the tools we belts use, how to use the tools of the trade and which situations they are most appropriate for. Let’s make this a series and focus on one tool weekly. To start with we’ll talk about ANOVA. I had a conversation with a fellow belt about this tool and we had the same consensus, it is quite possibly the most hated Six Sigma tool; so here’s what you need to know.
What is the Analysis of Variance?
ANOVA stands for Analysis of Variance and it’s used to highlight experimental differences. In English that means that ANOVA is used to highlight the differences between 2 or more sets of data.
What’s the best use?
Since the goal of ANOVA is to highlight differences, the best use for ANOVA is when you have 2 or more distinct sets of data that you need to get information from. So ANOVA is not appropriate when you don’t know what you’re measuring or how you are going to measure it. If you are thinking about using ANOVA you should be fairly far along in the Six Sigma project lifecycle.
There are three types of ANOVA models: fixed effects, random effects and mixed effects. Fixed effects are measurements for scenarios with a specific outcome. Random effects are measurements without specific outcomes, so basically you can throw a change in the process and see what happens. It is good for risk identification and will help you plan how potential problems affect the process. The final model is a mixed effect model, this model is a great way to gauge you ability to respond. It has a mixture of specific outcomes and random outcomes; a great way to keep the Six Sigma project team on their feet.
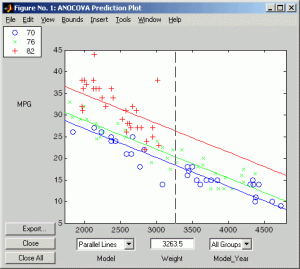
What does ANOVA look like?
How you statistical data will appear.
How your data will be displayed in a chart.

Now there is way more to ANOVA than this little summary, we didn’t cover error types, t-tests or variance types. For specifics-see your belt. This is just a summary to give you some basic knowledge on ANOVA and what it is supposed to accomplish, so now you can understand what your belt is and isn’t telling you.


